问题标题
How to bind the click event of the pie chart label?
Problem Description
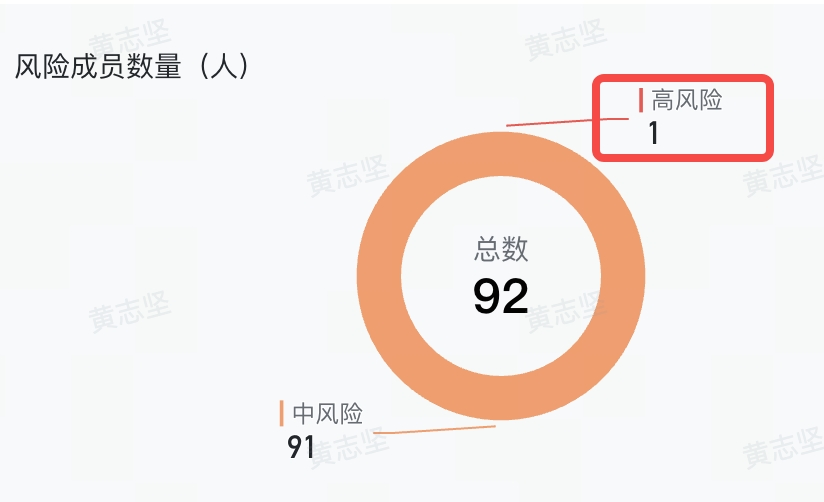
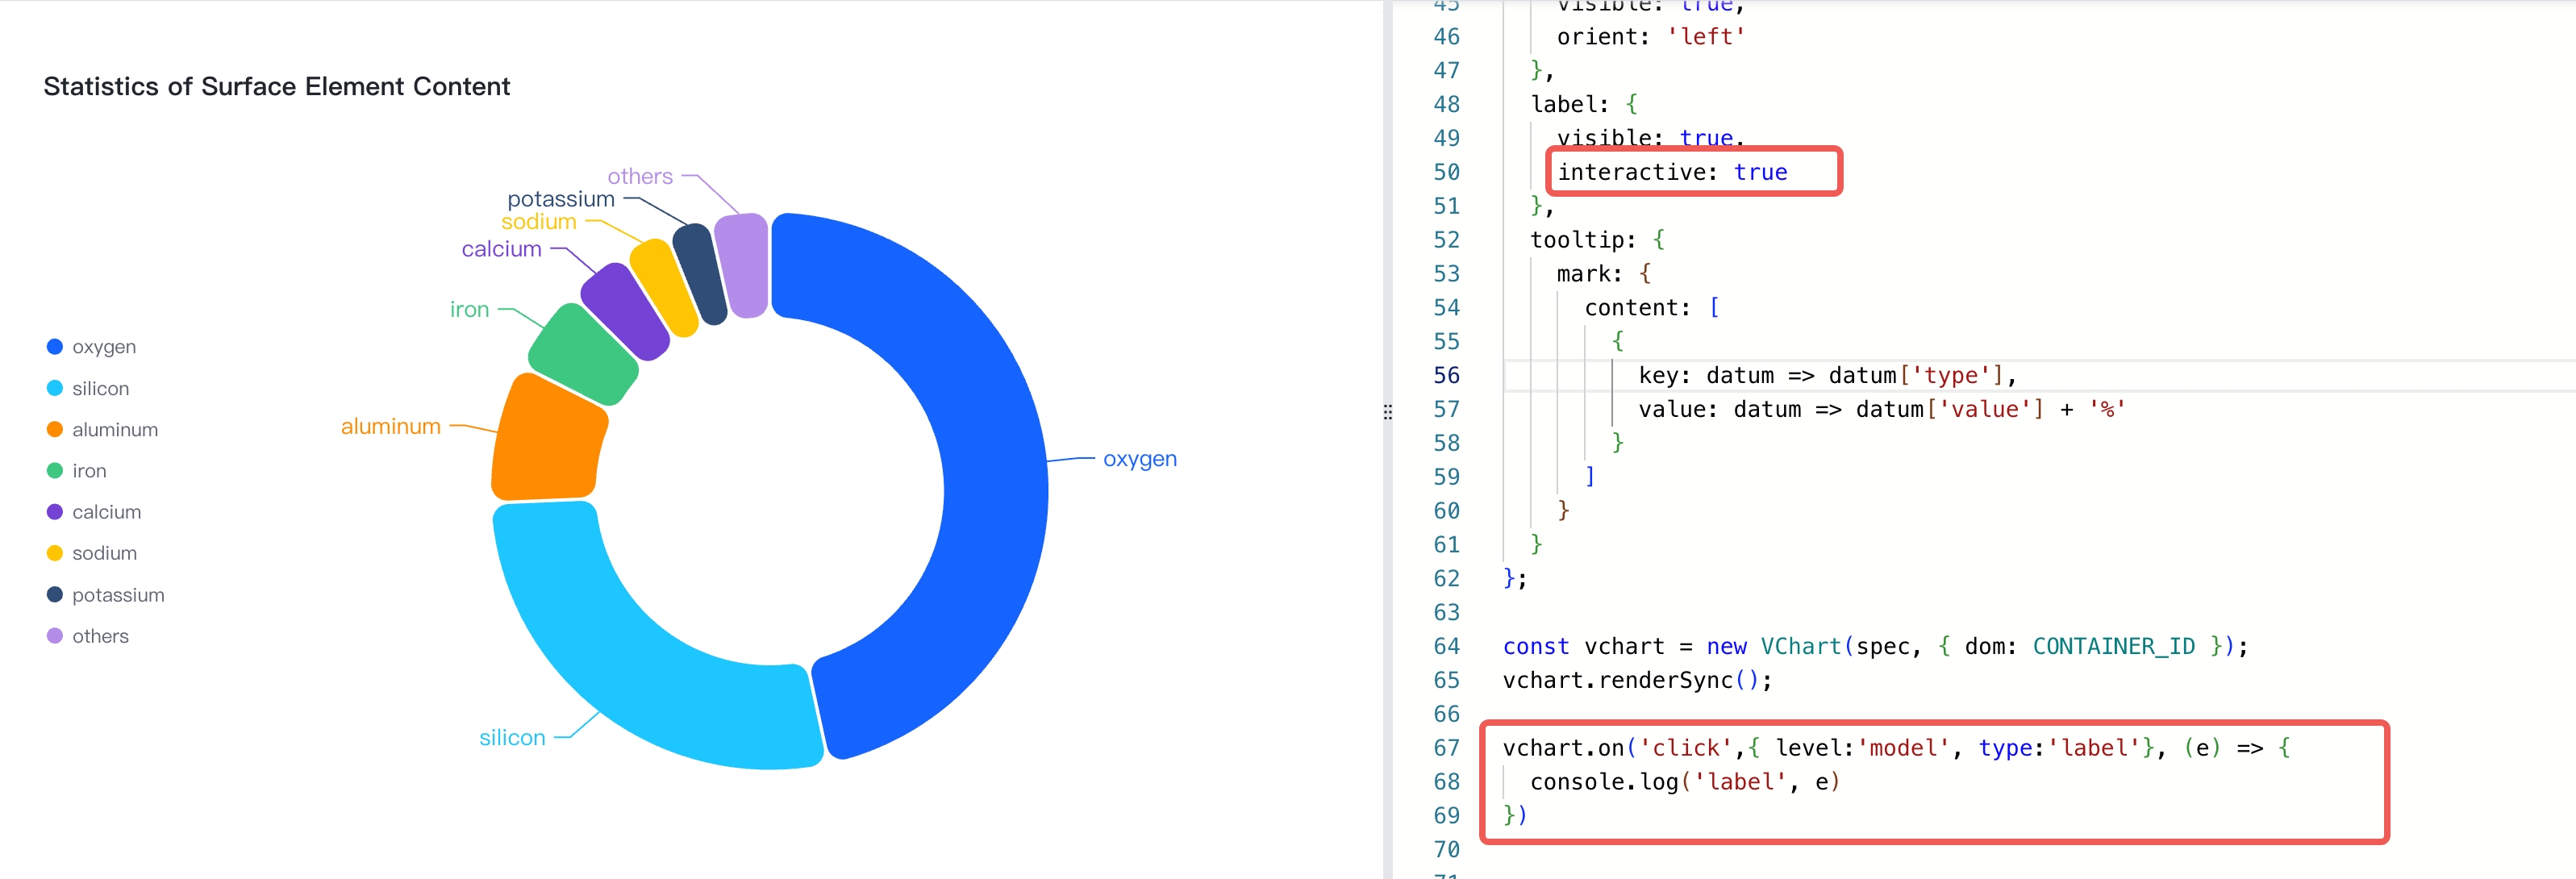
As shown in the pie chart below, how can I achieve a custom callback when clicking on a label?

Solution
In VChart, the label component does not respond to events by default. This is mainly to avoid affecting the event response of the main chart elements when the labels are dense. To achieve event listening of labels, you need to take two steps:
- Enable label event response by setting
label.interactivetotrue - Implement event listening of label components through
{ level: 'model', type: 'label' }

Code Examples
const spec = {
  type: 'pie',
  data: [
    {
      id: 'id0',
      values: [
        { type: 'oxygen', value: '46.60' },
        { type: 'silicon', value: '27.72' },
        { type: 'aluminum', value: '8.13' },
        { type: 'iron', value: '5' },
        { type: 'calcium', value: '3.63' },
        { type: 'sodium', value: '2.83' },
        { type: 'potassium', value: '2.59' },
        { type: 'others', value: '3.5' }
      ]
    }
  ],
  outerRadius: 0.8,
  innerRadius: 0.5,
  padAngle: 0.6,
  valueField: 'value',
  categoryField: 'type',
  pie: {
    style: {
      cornerRadius: 10
    },
    state: {
      hover: {
        outerRadius: 0.85,
        stroke: '#000',
        lineWidth: 1
      },
      selected: {
        outerRadius: 0.85,
        stroke: '#000',
        lineWidth: 1
      }
    }
  },
  title: {
    visible: true,
    text: 'Statistics of Surface Element Content'
  },
  legends: {
    visible: true,
    orient: 'left'
  },
  label: {
    visible: true,
    interactive: true
  },
  tooltip: {
    mark: {
      content: [
        {
          key: datum => datum['type'],
          value: datum => datum['value'] + '%'
        }
      ]
    }
  }
};

const vchart = new VChart(spec, { dom: CONTAINER_ID });
vchart.renderSync();

vchart.on('click',{ level:'model', type:'label'}, (e) => {
  console.log('label', e)
})

// Just for the convenience of console debugging, DO NOT COPY!
window['vchart'] = vchart;</br>
